GOOGLE MAPS SHOWING ANIMATED GRAPHICS TILES
The Google Maps API allow to create ImageMapType layers that allow you to overlay (partially transparent) bitmap tiles over Google’s original tiles. You can stack multiple layers to create interesting visualizations. However, these layers are static and can’t be animated. What if you wanted to show animated tiles, where you control when the animation starts and stops?
I had a project where I was asked to show current flow animations on top of Google Maps, rendered on the fly using a vector grid strategy. For every tile on a Google Map, and at any zoom level, I can produce an animation that looks like this:
This image is actually a GIF, and it’s shown here merely for illustration purposes, because GIF images are precisely what I don’t use, and that’s what this article is about.
Google Maps polygon animations and their limitations
If you want to move things around on a Google Map, and control when movement start and stops, the most flexible solution the Google Maps JavaScript API has to offer is its polygon drawing feature. There’s an extensive library of shapes you can draw on your map, including circles, triangles, rectangles, and polygons, which you can fully style. You can then move these polygons around, scale them, change their colors or edge thickness, all through easy JavaScript. Sounds good?
Too bad you can’t really use this in a real-world situation where you need to draw thousands of animated curves. For very many polygons, the browser would simply choke on all the drawing operations. And when it doesn’t choke, you’ll certainly feel the hit when you pan the map and all the polygons get redrawn (and only after panning is complete, so you get whitespace in the meantime).
Big JSON downloads
Worse, the JavaScript code will also need to download all the polygon data from the server. If it’s in a JSON format, it can be pretty big. Consider 10,000 triangles. That’s 30,000 data points, each consisting of two floating-point numbers, of, say, 10 digits each (depending on the precision you use, but for latitude/longitude at higher zoom levels, you’ll want high precision). That’s 600,000 bytes, and you can probably multiply that by two because of all the other fluff in the JSON source (variable names, commas, brackets).
Even if you do the heavy lifting on the server, like generating polygon definitions from source data and caching them as JSON files, you’ll be constantly downloading these big blocks of data.
No tiling support
The people who built Google Maps, and similar systems like OpenStreetMaps, Leaflet, Bing maps and whatnot, base their solutions on a key premise: when you need the ability to show the whole world to a user, in very great detail, the trick is to do it in tiles. Start with one 256x256 tile for the whole world, and then, for each step that the user zooms in, divide that tile up into a further four tiles. Keep doing this until you hit zoom level 18 or so, and you’ve got a lot of tiles. At the same time, the user only sees around 16 tiles on on their screen at any given time, so the browser is just downloading small groups of tiles for a total of 50KB or so per zoom level. When the user pans, you just load new tiles as they scroll into the screen.
OpenStreetMaps, for example, has detailed vector data for the entire world. When a user’s browser requests a tile, a bitmap is generated from that vector data, cached, and sent off to the user. A good many tiles for frequently-viewed areas are thus available in the cache and can be served fast, while others never even get generated at all. There aren’t many users who will view a patch of water in the middle of the Pacific Ocean in great detail, after all.
This is a great strategy for visualizing (parts of) huge maps using little resources. However, this strategy does not extend to polygon drawing. Polygons are not tile-based. If you give Google some coordinates and tell it to draw a polygon, it will try to draw it, even if it’s miles and miles off-screen. It may not actually draw the polygon, but it will have to calculate whether it’s on-screen every time you pan or zoom. That’s going to hurt with many polygons in memory.
So, polygon drawing is easy to use, but there are some use cases where things just get far too slow.
GIFs, and why they’re not so great
With polygon drawing out the window, another idea for showing animations is to bake them into tiles. Your server can render tiles when the browser requests them - exactly like Google’s own tiles - cache them, and then serve them. All frames for an animation could them simply be rolled up into a single bitmap. There are image formats that do this, and they are GIF and animated PNGs (APNG).
First off, APNG is out of the question, because browser support for it is unfortunately very poor - especially in Internet Explorer/Edge, naturally.
GIF also has a number of drawbacks, one of which is a dealbreaker:
- GIFs only support 256 colors, defined in a color palette. Though not an insurmountable obstacle, it gives you less freedom to create the visualizations you want.
- GIFs only support binary transparency. A pixel is either fully transparent, or it’s fully opaque. PNGs, on the other hand, support alpha transparency, where any pixel can have any level of opacity. This is very useful to give your animation antialiasing in order to make it blend against the background, that is, the underlying Google tiles.
- For multiframe GIFs, the speed at which their frames are played in the browser is baked into the GIF file. You can’t change this speed afterwards. This is OK if you can settle on a fixed speed and stick with it, but controlling animation speed in the browser will be impossible.
- Animated GIF images start playing as soon as they are displayed in the browser.
That last point is where the real problem lies.
When the browser first needs to show your map, or whenever you change the map’s zoom level, it will request a number of tiles from the server. Google Maps does this by sending a separate request to the server for each tile. You then handle that request, render a tile, and send it back.
The tiles, then, will come into the browser at intervals. Some arrive earlier than others. There may be one that takes a second longer, due to the fickle nature of the internet connection. And that means that all GIFs start playing their animations at different times.
Here comes the clincher. You cannot control GIF animation in the browser. You can’t start or stop it, not even if you have a reference to the Image DOM element. There’s no feature for that.
Using a PNG strip for animation
If we can’t bake our animations into GIFs or APNGs, we’ll need to do something else. There is another way to store an entire animation into an ordinary PNG, and that’s by creating a PNG strip (or a sprite sheet, if you will). The idea is this:
![]()
The frames of the animation are simply placed in a wide image from left to right. In our case, since a Google map tile is always 256x256, our PNG would by 256 pixels high and however wide we need it to be to contain all of our frames. For 32 frames, it would be 8,192 pixels wide. That sounds big, but PNGs apply lossless compression, so your rendered animation strip may well be only 10KB or so in size, depending on the complexity of your animation.
With this strategy, we can now create an ImageMapType instance in our Google Maps JavaScript that requests these images from the server. But when they’re shown, they’ll be squashed, since Google will force each image into a 256x256 box. They’ll also not be animated, of course.
For animation to actually happen (and in a way that we can control if it happens, and how fast it happens), we need to implement a simple image carousel. If you have no idea where this is going, have a look here, which is also where I found the image below.
An image carousel, in our case, is a square <div> element, the size of one tile, that contains a long filmstrip that slides through it. At any given time, the <div> only shows a small part of the strip (one frame), and it acts like a little window on the animation. Precisely like a movie projector.
Suppose we had a six-frame animation, and we’re currently showing the first frame, then things would look like this:
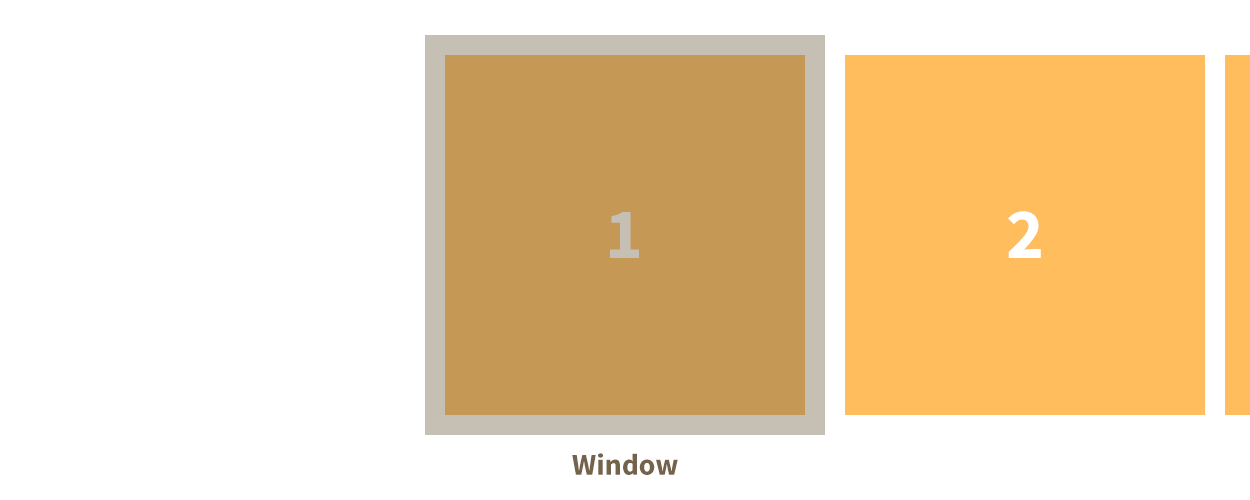
To show the second frame, we set some CSS styling on the film strip image to offset it 256 pixels to the left. For the third image it would be 512 pixels, and so on. When we run out of frame, we set the offset back to 0. Do this at a regular interval, and you’ve got an animation that you can control.
To make this happen, we need to do two things:
- Whenever Google Maps loads a tile image from the server, we must intercept it when it comes into the browser. Instead of placing an
<img>in the DOM, as Google Maps, we want it to be a<div>containing an<img>, so we can apply our carousel technique. - Also, whenever a new tile arrives, we’ll need to get a reference to it somehow, so that we know which tiles are currently shown so we can control their animation. In the same way, we’ll want to know when tiles are removed from the map so we can stop animating them.
This is where it gets tricky. Google’s ImageMapType API does not offer any way for us to be notified when a tile comes in. The only event that comes remotely close is tilesloaded, which lets us know when all visible tiles have finished loading. We won’t know how many they are, and we’ll have no references to the <img> elements that Google Maps created. There aren’t any other events, so there does not seem to be a way to do the interception that we need to do.
The ace up the sleeve: MutationObserver
Well, that approach died before it even began… or did it? There is actually a trick we can use to know when Google Maps adds or removes tiles to an image tile layer. Google may play its cards close to its chest, but HTML5 comes to the rescue. There is a newish feature called the MutationObserver. (Before you say, “Oh, so supported in only cutting edge browsers then,” - no, prepare to be happy).
The MutationObserver interface provides the ability to watch for changes being made to the DOM tree. It is designed as a replacement for the older Mutation Events feature which was part of the DOM3 Events specification. (MDN)
Though there isn’t a lot of documentation on it, the MutationObserver is simple to use. Create an instance of it, and have it listen for changes to an element. It can monitor changes in a tree of elements, so you can just have it listen to you Google Maps element and know when anything is added or removed:
var observer = new MutationObserver(function (mutationsList, observer) {
  for(var i = 0; i < mutationsList.length; i++) {
    var mutation = mutationsList[i];
    if (mutation.type === 'childList') {
      addAnimationImages(mutation.addedNodes);
    }
  }
});
observer.observe(document.getElementById("map"), { childList: true, subtree: true });
Here, we tell the MutationObserver to attach itself to our map element, and we tell it to listen for changes to its children (childList) and any of their children (subtree). When a change is detected, the function passed to the MutationObserver’s constructor is called which a list of mutations. There can be various types of mutations, but we’re interested in mutations of type childList, that is, elements added to or removed from our map. The MutationObserver actually detects lots and lots of changes, like attribute changes, so we’ll ignore most of them. Also notice that we only listen for nodes being added (addedNodes). We’ll deal with removals later.
Now, specifically, we need to know when a tile is added to the map, and not just any tile, but a tile from our image layer. If you study the DOM elements that Google Maps generates by using browser developer tools, you’ll notice that it always adds something like this, for each tile:
<div style="position: absolute; left: 0px; top: 0px;">
  <img style="width: 256px; height: 256px;
    user-select: none;
    border: 0px none;
    padding: 0px; margin: 0px;
    max-width: none;"
    draggable="false" alt="" role="presentation"
  src="http://yourserver.com/tileapi/1/2/3/4">
</div>
The attributes of the outer <div> vary (that’s the tile’s position on the screen), but the <img> always looks the same. We can also tell that this is one of “our” images, because it contains a URL that points to our server, not Google’s.
What we need to do, then, is replace the <img> element with a <div><img></div> structure, with CSS attributes for our animation, so something like this:
var animContainer = document.createElement('span');
animContainer.style.position = "absolute";
animContainer.style.display = "block";
animContainer.style.width = "256px";
animContainer.style.height = "256px";
animContainer.style.overflow = "hidden"; // For carousel
div.appendChild(animContainer);

var img = document.createElement('img');
img.style.position = "absolute";
img.style.left = "0px";
img.style.top = "0px";
img.style.width = "8192px"; // Total PNG strip width
img.style.height = "256px";
img.style.userSelect = "none";
img.style.border ="0x none";
img.style.padding = "0px";
img.style.margin = "0px";
img.style.maxWidth = "none";
img.draggable = false
img.alt = "";
img.role = "presentation";
img.src = src;
animContainer.appendChild(img);
(I lied. I use a
<span>, not a<div>, because it makes it easier to tell elements I generate apart from the mountains of<div>elements that Google creates, but that’s just a detail.)
There’s another thing we must do: whenever we create an animated tile like above, we must store a reference to in a list of tiles currently on the screen. That way, we’ll be able to use that list when we actually run our animations. This also means that we must remove an animated tile from that list when it is unloaded from the DOM. Google does the unloading; all we have to do is use a MutationObserver to detect when it happens.
To keep things simple, our original MutationObserver only listens for nodes being added. We could have it listen for deletions, too, but then we would have to go through the trouble of checking whether it’s actually one of our tiles being deleted, or something else. There’s a simpler way. We can just attach a new, throw-away MutationObserver to each animation element that we create, and it will let us know precisely when that element is deleted. We actually do this by attaching the MutationObserver to our element’s parent, because we’re only allows to listen to child deletions, but that’s OK. Here goes:
function onRemove(element, onDetachCallback) {
  var observer = new MutationObserver(function () {
    function isDetached(el) {
      if (el.parentNode === document) {
        return false;
      } else if (el.parentNode === null) {
        return true;
      } else {
        return isDetached(el.parentNode);
      }
    }
    if (isDetached(element)) {
      observer.disconnect();
      onDetachCallback(element);
    }
  });
  observer.observe(document, {
        childList: true,
        subtree: true
  });
}
So, at this point, whenever a new animated tile gets downloaded by Google Maps, our detection mechanism makes sure it is replaced by a carousel construction, that we know which carousels are currently on-screen, and that carousels get deleted when Google removes their tiles.
Playing the animation
Now for the payoff. We’ve got a list of references to carousels on the screen. In order to play them all, in sync, we can simply use requestAnimationFrame:
function animate() {
  for(var i = 0; i < tileImages.length; i++) {
    tileImages[i].style.left = (-offset * 256).toString() + "px";
  }
  offset++;
  // (There are 32 frames in each animation.)
  if(offset >= 32) offset = 0;
  window.requestAnimationFrame(animate);
}
window.requestAnimationFrame(animate);
Here, tileImages is the list of references to carousel elements.
The animation will now all play the same frame index, and they play at 60fps, because that’s approximately how fast requestAnimationFrame runs things. That may actually be much too fast (it was, for my current flow animations), so you may want to introduce a delay by skipping some of the draw requests:
var offset = 0;
var animStep = 0;
function animate() {
  animStep++;
  if(animStep >= 3) {
    animStep = 0;
    for(var i = 0; i < tileImages.length; i++) {
      tileImages[i].style.left = (-offset * 256).toString() + "px";
    }
    offset++;
    if(offset >= 32) offset = 0;
  }
  window.requestAnimationFrame(animate);
}
window.requestAnimationFrame(animate);
Now, because we have baked our animations in bitmaps, we end up with a fast solution for two reasons:
- Animations are tile-based. Only the animations that need to be shown are downloaded from the server.
- Animations are light-weight. All the browser has to do is show a PNG image and change a CSS property for each frame.
As a bonus, features can now be added to the user interface for the user to interact with the animation, like play/pause button, or an animation speed slider control.
Happy animating!