CREATING CUSTOM GEOJSON MAPS FOR HIGHMAPS WITH QGIS
Highcharts is a powerful framework for displaying and manipulating interactive charts in an HTML canvas element using JavaScript. Apart from charts, the framework also offers a mapping implementation, with builtin maps of many countries as well as the possibility to use your own maps. Maps can be produced using any GIS software that allows export to GeoJSON (such as QGISor ArcGIS) which is the format that Highcharts can read.
In this post, I’ll have a quick look at how you can draw a custom map for Highcharts/Highmaps using QGIS, how to export it to GeoJSON and how you can get Highmaps to display it.
Getting QGIS
QGIS is a free, open source GIS implementation which is great for people who don’t have the money to buy ArcGIS, which is everyone because ArcGIS is expensive, particularly so it you only want to build a few simple maps. QGIS can be downloaded from the QGIS website here. Note that it’s a hefty download weighing in at about 200 MB. There are also some user manuals available with exercise materials (another 200+ MB). Installing QGIS is as simple as click, click, finish.
Drawing a map in QGIS
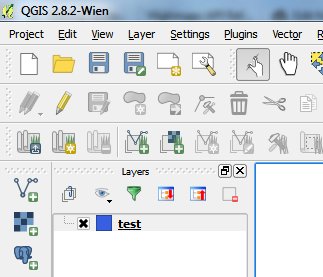
QGIS’s user interface can be daunting af first, especially since we’re only going to use a fraction of its functionality. QGIS can connect to many different data sources to get GIS data from, none of which is interesting right now since we’re drawing our own map. To start your own map, create a new Project through Project -> New. QGIS shows you a fresh empty screen for you to draw your map on:

Unfortunately, you will find that clicking and dragging your mouse over the drawing area does nothing at all. This is because all the action happens in layers You must create a new layer before you can draw the bits of your map, and a project can have any number of layers, usually to store areas of land in one layer, rivers in the next, and roads in yet another. To create a new layer, go to Layer -> Create Layer -> New Shapefile Layer. There are other layer types, but a Shapefile is the typical layer for drawing maps freehand. QGis will now want to know some basic information about the layer:

For a map that’s usable in Highmaps later on, we will want to draw polygons. QGis also allows layers that consist of points or lines, but that’s not what we need right now, so be sure to select “Polygon” now. If you miss this, you will not be able to change it later! Also, map elements (i.e. polygons) will by default be adorned with an ID number which will be useful in Highmaps. However, let’s add a name value to each polygon as well. To do so, fill out “name” for New attribute. It’s going to be a text value, so we can leave the type definition “Text data” and “Width” of “80” as-is. Click Add to attribute list to add the new “name” attribute to the attribute list. Finally, click OK to create your layer.
QGIS will now ask you what file to save the layer data in. Create a new file, e.g. “test.shp” somewhere and save it. You will now see a new layer named “test” appear in the layer window:
The layer name “test” is derived from the filename you selected. You can change the display name later.
Now to draw your first polygon. If you click and drag in the drawing space, you will notice that you still can’t draw anything, even though you’re working in a fresh layer. To draw polygons, you need to switch to editing mode and then select Add Feature. The image below makes this clear:
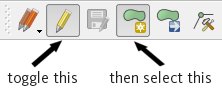
You have to be in edit mode in order to draw anything. When you’re done drawing, remember to select the double pencil (the leftmost item) and tell QGIS to save whatever you drew. Now you can place your mouse over the drawing area and draw a polygon point-by-point:
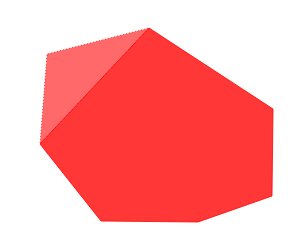
When you’re done adding points to your polygon, right-click to close and finish it. QGIS will now ask you for an ID and name for your polygon (remember defining these fields for the layer?). Give it an id of 1 and a name of Vorg, which is your first province. You can now carry on and draw additional provinces, trying to line them up neatly with the other provinces. Soon, you’ll have something like this:
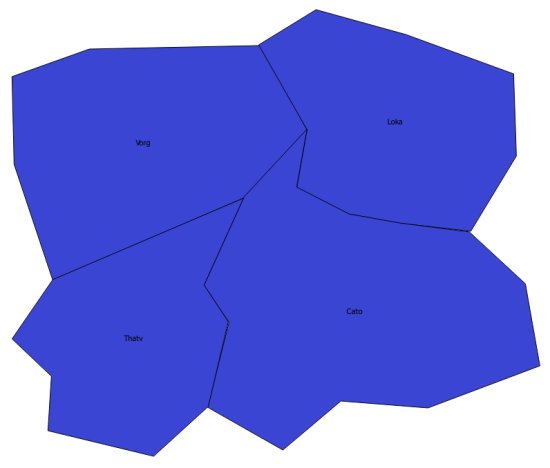
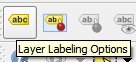
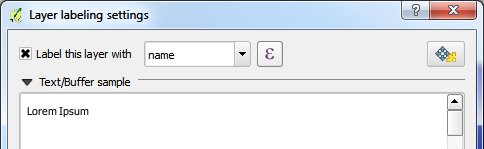
With some polygons in place, it would be nice if the names you entered actually appeared on the screen so you can identify them. To make this happen, click the Layer labeling options button and configure QGIS to show the “name” value for each polygon:
Your polygons should now have labels.
There’s lots more to say about working with QGIS, even at this very basic level, but the goal of this article is to get the QGIS data into GeoJSON format. However, here are some quick pointers:
- You can click and drag polygon points to make corrections to your drawing. To enable this mode, click the Node Tool. It’s next to the Add Feature button you used earlier.
- If you right-click on the layer name (“test”) and then select Open Attribute Table, you can edit the IDs and names you gave to your polygons. This is useful if you need to correct a mistake.
- If you click on Identify Features (looks like an info button), then you can click polygons and their data appears in the sidebar. This is useful for navigation when your map gets bigger.
Exporting to GeoJSON
Using QGIS is a means to an end, since we could have used and mapping software package that exports to GeoJSON data. In the case of QGIS, exporting is done layer-by-layer. To export a layer to GeoJSON format, select Layer -> Save As. In the export dialog that appears, fill out the name of the .geojson file to create, and be sure to turn off Add saved file to map. Click OK to export.
qgis-export-to-geojson.jpg
You’ll get a lovely .geojson file that looks like this (I’ve replaced series of coordinates with … to remove clutter):
{
  "type": "FeatureCollection",
  "crs": { "type": "name", "properties": { "name": "urn:ogc:def:crs:OGC:1.3:CRS84" } },

  "features": [
    { "type": "Feature",
      "properties": { "id": 1, "name": "Vorg" },
      "geometry": { "type": "Polygon", "coordinates": [...] ] }
    },
    { "type": "Feature",
      "properties": { "id": 2, "name": "Loka" },
      "geometry": { "type": "Polygon", "coordinates": [...] ] }
    },
    { "type": "Feature",
      "properties": { "id": 3, "name": "Cato" },
      "geometry": { "type": "Polygon", "coordinates": [...] ] }
    },
    { "type": "Feature",
      "properties": { "id": 4, "name": "Tharv"},
      "geometry": { "type": "Polygon", "coordinates": [...] }
    }
  ]
}
As you can see, the .geojson format consists of a list of features, each with a type, properties and geometry. Since we’ll always use polygons for Highmaps, the type is always “Feature”. The properties are the ones we defined in QGIS (and we can use them later in Highmaps!). Since this is a bit of JSON, we can use it directly in any JavaScript code and that’s exactly how Highmaps works. We’ll just create a JavaScript file called “map.js” and assign the GeoSON content to a variable:
map = {
  "type": "FeatureCollection",
  "crs": { "type": "name", "properties": { "name": "urn:ogc:def:crs:OGC:1.3:CRS84" } },

  "features": [
    ...
  ]
};
Now we’re ready to go. Let’s get Highmaps, and insert our map into a web page!
Getting Highmaps
Highmaps is a module for Highcharts. According to the docs, you can use Highmaps as a standalone implementation, or combine it with Highcharts if you’re using non-map charts. I’ll assume that is the case.
Here’s how you load Highcharts and Highmaps. Note that the libraries require jQuery to be loaded as well:
<script src="http://ajax.googleapis.com/ajax/libs/jquery/1.8.2/jquery.min.js"></script>
<script src="http://code.highcharts.com/highcharts.js"></script>
<script src="http://code.highcharts.com/maps/modules/map.js"></script>
Configuring Highmaps
Your map will need a place to live. Add a container somewhere to your HTML page:
<div id="map"></div>Load the map.js script which contains our GeoJSON content. Do this after loading the other scripts.
<script src="map.js"></script>Then, at the very bottom of your index.html, after the script loading tags, add some JavaScript to initialize your map.
<script type="text/javascript">// <![CDATA[
  (function() {
    $('#map').highcharts('Map', { series : [ { mapData: map } ] });
  )());
// ]]></script>
Here, I’ve done the absolute minimum to get a map loaded and shown. There is a lot more to configure:
- Showing labels
- Connecting a dataset of values to the map elements
- Adding zoom buttons
- Coloring the map
For all this, I’ll refer you to the Getting Started section of Highmaps.